Part 1 demonstrated the final generated SCG charts. Here we will look at the starting point—the source roadmap data files.
The roadmap charts describe changing level data across a number of implementation states. The charts are not project planning tools and therefore the durations are neither defined nor indicated in the widths on the charts.
Maturity Level information can be 0, 1, 2 and 3 or where there is additional assurances in place beyond those indicated by the Level, the “+” symbol can be used so 0+, 1+ and 2+ are also allowed if required. For charting purposes these are treated as ½, 1½ and 2½. There is no assumption that Maturity Levels will increase through subsequent states; Maturity Levels can fall as well as rise, or remain static.
States
“Roadmaps … consist of [states] (the vertical bars) in which several Practices are each improved by one Level. Therefore, building a roadmap entails selection of which Practices to improve in each planned [state].” SAMM v1.0
Unlike in the previous spreadsheet version, the number of states (phases, steps or stages) which can be charted is flexible from 2 to 10. The greater the number of states there are, the wider the final generated chart will be. We will see below that your “states” can be called anything you want.
Format
Download the archive of files.
The archive contains two example SAMM Roadmap XML files. The primary structure of the XML files is:
<?xml version="1.0" encoding="iso-8859-1"?>
<maturity>
	<title>...</title>
	<states>
	...
	</states>
</maturity>
where the title (XML encoding) is used as a heading on the chart legend, and the Maturity Level data are included between the <states></states> markup tags.
The first markup within the section must be the Maturity Levels at the start i.e. state 0 (zero). State 0 has a title (“Start” in the example below) and description, but these are not used or displayed. All security Practices that are to appear on the roadmap must be defined within the <levels> markup.
<state number="0">
	<title>Start</title>
	<description></description>
	<levels>
		<level security-practice="SM" value="1" />
		<level security-practice="PC" value="0" />
		<level security-practice="EG" value="0" />
		<level security-practice="TA" value="0" />
		<level security-practice="SR" value="0" />
		<level security-practice="SA" value="0" />
		<level security-practice="DR" value="0" />
		<level security-practice="CR" value="1" />
 		<level security-practice="ST" value="0" />
		<level security-practice="VM" value="0" />
		<level security-practice="EH" value="0" />
		<level security-practice="OE" value="0" />
	</levels>
</state>
The values for the attribute “security-practice” must match the security Practice attribute “id” defined in the <security-practice> markup tag within the base SAMM XML file (e.g. SAMM-1.0-XML-0.3-en_US.xml mentioned in Part 1). “SM” is “Strategy & Metrics”, “PC” is “Policy & Compliance”, etc.
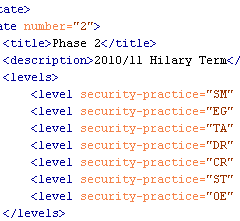
Subsequent state numbers (1, 2, 3, etc) must include values for the title, description, and as mentioned in Part 1, only data for Practices where the Maturity Level changes should be included:
<state number="1">
	<title>Phase 1</title>
	<description>2010/11 Michaelmas Term</description>
	<levels>
		<level security-practice="EG" value="1" />
		<level security-practice="SR" value="0+" />
 		<level security-practice="ST" value="1" />
		<level security-practice="VM" value="0+" />
	</levels>
</state>
<state number="2">
	<title>Phase 2</title>
	<description>2010/11 Hilary Term</description>
	<levels>
		<level security-practice="SM" value="2" />
		<level security-practice="EG" value="2" />
		<level security-practice="TA" value="1" />
		<level security-practice="DR" value="1" />
		<level security-practice="CR" value="2" />
 		<level security-practice="ST" value="2" />
		<level security-practice="OE" value="1" />
	</levels>
</state>
Subsequent stages are defined in the same manner. The file is saved with an XML extension.
For the eagle-eyed amongst you, you might have noticed a vertical dashed line in the SVG example shown in Part 1, which doesn’t appear in any of the roadmaps in the SAMM document. This is a new optional attribute which can be added to one of the stages. Just add the attribute “marker” with value “true” in one of the <state> tags and the line will be drawn. This might mean "status now" or an important event on the timeline, but that can be described in your accompanying text or presentation.
Validation
We tried the make the source data files as human-readable as possible, but thought we also needed to provide a way to validate the format.
Firstly check the file is well-formed. The simplest method is to use the W3C Markup Validation Service to upload the file or directly input the file content. If your data contains confidential information, you may want to undertake this check locally instead.
Then once the file has passed the previous check, test the XML structure against the XML Schema Definition (XSD) provided in the download link above:
SAMM-1.0-roadmap-0.3.xsd
You will need some sort of XML tool for this. The XSD includes some assertion statements, and therefore needs XSD v1.1 enabled in a Saxon parser. It also has some Schematron statements which should be validated as well.
Now you should have validated XML files.
Continues…
In Part 3 tomorrow, the automated process for transforming the source data into the final SVG files will be described.
