OpenSAMM documentation has a big design wow factor and SAMM users, such as development companies, auditors and security consultants, are often keen to mimic the style, especially the graphs. So, last year I developed a Microsoft Excel spreadsheet to help in the creation of roadmap charts.
However it was a bit of a fudge to make the output look similar to the Adobe Illustrator versions in SAMM. The spreadsheet was difficult to alter if you had more than four stages in the roadmap, it was restricted to whole level values (not 0+, 1+ or 2+), and it included background images making it fiddly to edit.
A better way?
Open Office Calc didn’t seem to provide enough functionality to generate the charts, and Microsoft Visio is quite expensive, and even then I couldn’t make it format the data as required. Last year I was invited by David Rook to present SAMM at an OWASP Ireland chapter meeting in Dublin. After the presentation, I spoke with Eoin Keary (OWASP Board member) and we discussed whether a server-side option could be built which would be more flexible. But I had begun using Scalable Vector Graphics (SVG) for another project and realised these would be a better solution for creating the charts, since modern web browsers support SVG markup directly and it could all be created locally rather than using a remote service.
SVG charts
I began working on some mockups, and in March this year posted them to the SAMM mailing list, asking if anyone else had any XML Path Language (XPath) or Extensible Stylesheet Language Transformations (XSLT) experience with which to help improve my initial efforts. Brenda Larcom kindly replied. What a difference she made. Brenda’s initial ideas included:
- have a more explicit/human-readable connection between the state (phase, stage or step) and the target maturity levels for that state;
- use sparse data, i.e. if a level doesn’t change in a state, the chart uses the data from the previous state; and
- segregate data (put the data in elements) from display options (put options in attributes).
We spent the next couple of months bouncing ideas and files back-and-forth, and Brenda’s expertise meant we ended up with a much more compact file structure. SAMM project leader Pravir Chandra also helped by providing all the textual information from SAMM in an XML file. The base US English XML file (version 0.3) for SAMM v1.0 is currently available (SAMM-1.0-XML-0.3-en_US.xml in a Zip archive on the SAMM download page, adjacent to the PDF version). Save that—you’ll need it in Part 3.
With one thing and another, it’s been a little while since then, but Pravir asked if we could share our efforts via this blog rather than using the mailing list alone.
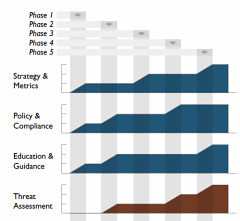
I’d like to begin at the end, and show you examples of the generated SVG files.
Examples
Download the archive of files.
We need an external style sheet (included in the download above) to view the generated SVG files. Extract SAMM-1.0-roadmap-0.4.css into a directory, for example:
e:\path\samm\roadmap-part-1
Then extract the two example SVG files into the same directory. If you view the source of the SVG files, you will just see the XML content like this partial view below:
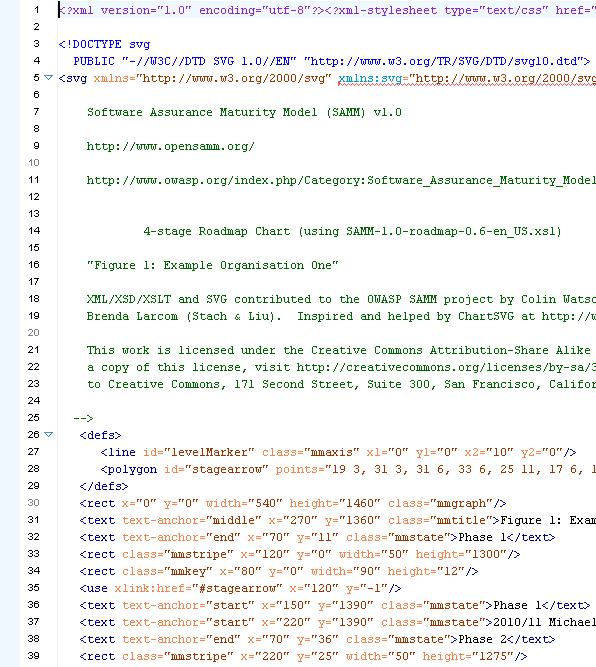
Example SAMM Roadmap Chart Source Code
You can use your web browser to render the chart visually. Open each SVG file in turn from the directory, for example:
file:///e:/path/samm/roadmap-part-1/roadmap-ex1.svg
You should see something like the JPEG screen capture below:
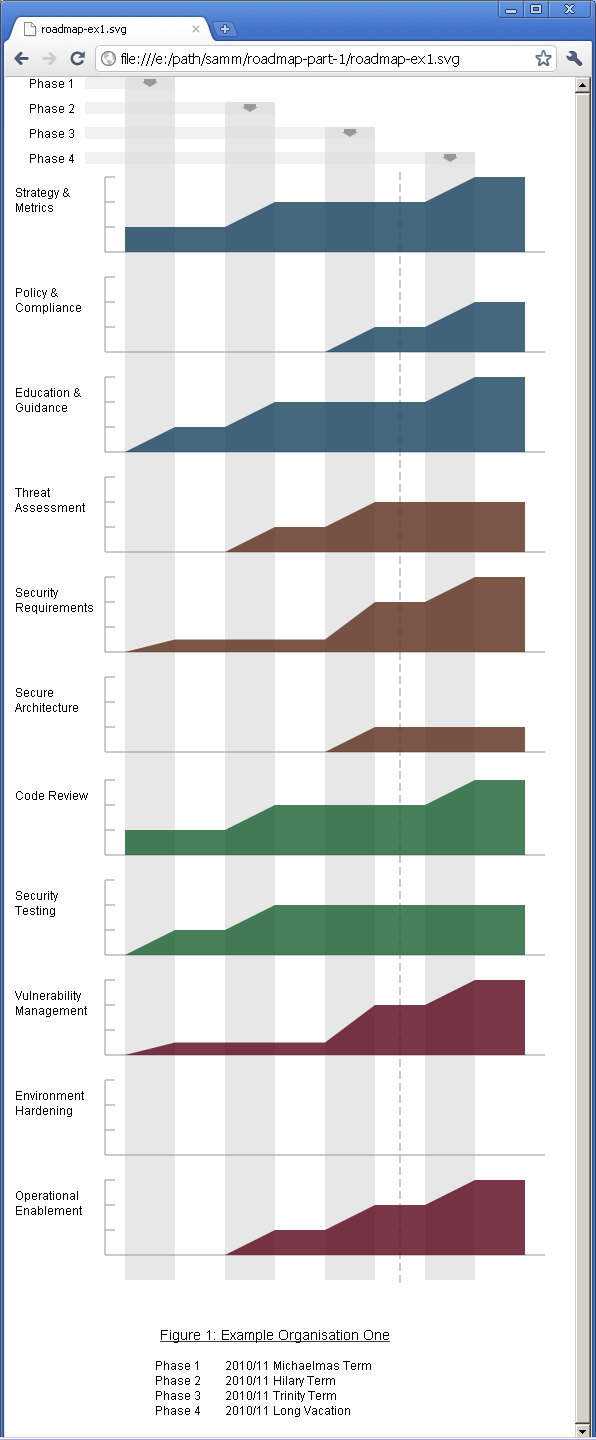
Example Rendered SAMM Roadmap Chart
The charts are of a fixed size, but you can alter your browser zoom level. If you want a static file, take a screen capture the image and paste it into your report. The external style sheet file is referenced from within the SVG file like this:
<?xml-stylesheet type="text/css" href="SAMM-1.0-roadmap-0.4.css"?>
So if you change the CSS filename or location, you must edit the SVG file (perhaps just using a text editor). You can of course customise the CSS file to alter the chart appearance.
Continues…
In Part 2 on Monday, the XML format for source roadmap data will be discussed, and in Part 3 an automated process for transforming that data into the final SVG files, like the one above, will be described.
