Posts Tagged presentation
Scorecard Chart Generation
Posted by Colin Watson in Discussion on August 7th, 2012
Building on the work undertaken with Brena Larcom to create SAMM roadmap charts (Part 1, Part 2 and Part 3), I have developed a similar process for single point in time scorecards.
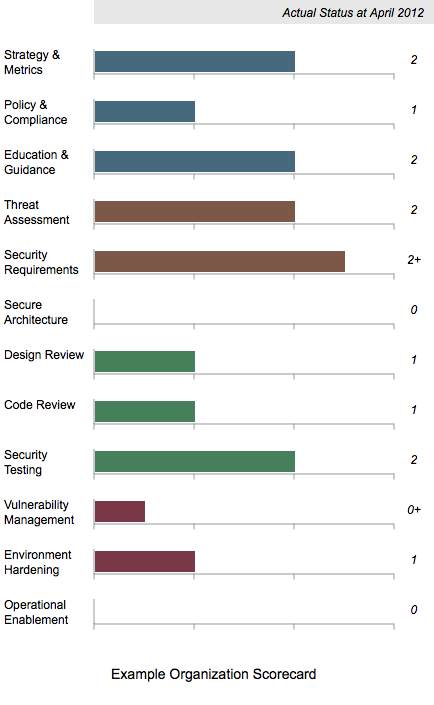
Example Single Point In Time Scorecard
The XML is a very similar structure as used for the roadmap charts, but only one set of data are required.
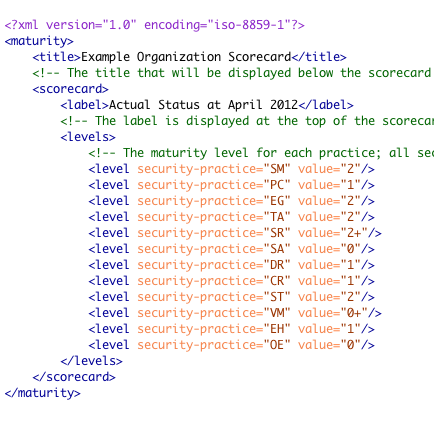
Source XML Data to Create the Example Scorecard
Like the roadmap files, Maturity Level information can be 0, 1, 2 and 3 or where there is additional assurances in place beyond those indicated by the Level, the “+” symbol can be used so 0+, 1+ and 2+ are also allowed.
Download the files
Download the archive of files.
The archive includes the an example XML file and the US English SAMM base XML file. Remember the latter should normally be downloaded from the SAMM download page. Using a web browser, open the example SVG file from the directory, for example:
file:///e:/path/samm/scorecard/scorecard-ex1.svg
Create your own chart
Edit and save the XML file. Then check the file is well-formed. The simplest method is to use the W3C Markup Validation Service to upload the file or directly input the file content. If your data contains confidential information, you may want to undertake this check locally instead.
Then once the file has passed the previous check, test the XML structure against the XML Schema Definition (XSD) provided in the download link above:
SAMM-1.0-scorecard-0.2.xsd
Take a tool which can undertake XSLT conversions, and apply SAMM-1.0-scorecard-0.2-en_US.xsl to your XML file. An SVG file should be created. That’s all there is to it.
Again if you don’t want to use XML and XSLT, you can just edit the SVG files directly using some sort of text editor.
OpenSAMM in eBook Format
Posted by Colin Watson in Discussion on April 1st, 2011
The OpenSAMM 1.0 English XML source file has been converted into an eBook format by Paweł Krawczyk.
You can read more about the file and download it on IPsec.pl at http://ipsec.pl/node/967
OpenSAMM Overview Presentation in French
Posted by Pravir Chandra in Discussion on October 20th, 2010
 Thanks to Hubert Grégoire and Sebastien Gioria, we now have a French translation of the OpenSAMM 1.0 Overview presentation available for download. You can get it from the download tab or there is a direct link here.
If anyone else has translated the presentation to other languages for local chapter presentations, please feel free to send them to me (or the mailing list) and we’ll get them posted for all to access.
Roadmap Chart Generation – Part 3 of 3
Posted by Colin Watson in Discussion, Releases on September 27th, 2010
Yesterday Part 2 described how to create and validate the source roadmap data files. In this post, transforming the data files into the final SVG format we saw in Part 1 will be described.
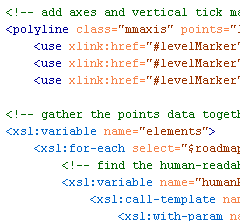
The great thing about having data in XML is the ability to translate it easily into another format using Extensible Stylesheet Language Transformations (XSLT).
Transformation
Download the archive of files.
With Brenda’s assistance we now have an XSLT file which can be used to translate a valid and well-formed SAMM Roadmap source data file into a valid SVG file. You need the two XSL files included in the archive download linked above:
SAMM-1.0-roadmap-0.6-en_US.xsl
SAMM-1.0-utilities-0.1.xsl
You also need the base US English XML file (version 0.3) for SAMM v1.0 and your XML data files. The archive includes the two example XML files from Part 1 (again) and the US English SAMM base XML file. Remember the latter should normally be downloaded from the SAMM download page. Place all the files in a new directory.
Take a tool which can undertake XSLT conversions, and apply SAMM-1.0-roadmap-0.6-en_US.xsl to your XML file or one of the examples. An SVG file should be created.
Partial screen capture (as a JPEG) of a generated SVG SAMM Roadmap Chart
And that’s it. Alter your XML files to see the effect on the generated SVG charts.
If you don’t want to use XML and XSLT, you can of course just edit the SVG files directly using some sort of text editor.
Next
I hope to spend some time creating SVG charts for the SAMM scorecard charts sometime soon.
Roadmap Chart Generation – Part 2 of 3
Posted by Colin Watson in Discussion, Releases on September 27th, 2010
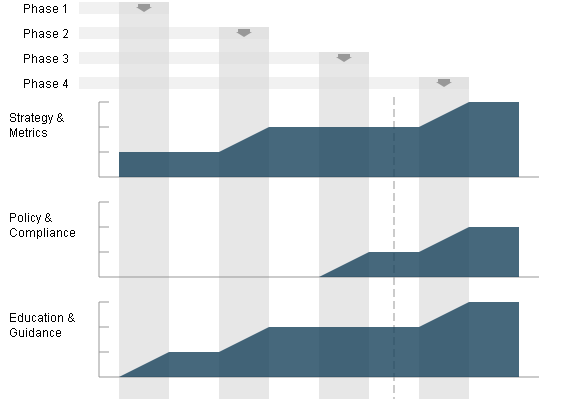
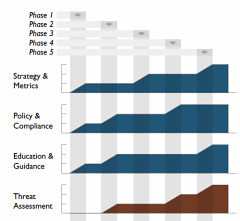
Part 1 demonstrated the final generated SCG charts. Here we will look at the starting point—the source roadmap data files.
The roadmap charts describe changing level data across a number of implementation states. The charts are not project planning tools and therefore the durations are neither defined nor indicated in the widths on the charts.
Maturity Level information can be 0, 1, 2 and 3 or where there is additional assurances in place beyond those indicated by the Level, the “+” symbol can be used so 0+, 1+ and 2+ are also allowed if required. For charting purposes these are treated as ½, 1½ and 2½. There is no assumption that Maturity Levels will increase through subsequent states; Maturity Levels can fall as well as rise, or remain static.
States
“Roadmaps … consist of [states] (the vertical bars) in which several Practices are each improved by one Level. Therefore, building a roadmap entails selection of which Practices to improve in each planned [state].” SAMM v1.0
Unlike in the previous spreadsheet version, the number of states (phases, steps or stages) which can be charted is flexible from 2 to 10. The greater the number of states there are, the wider the final generated chart will be. We will see below that your “states” can be called anything you want.
Format
Download the archive of files.
The archive contains two example SAMM Roadmap XML files. The primary structure of the XML files is:
<?xml version="1.0" encoding="iso-8859-1"?>
<maturity>
	<title>...</title>
	<states>
	...
	</states>
</maturity>
where the title (XML encoding) is used as a heading on the chart legend, and the Maturity Level data are included between the <states></states> markup tags.
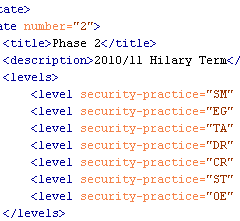
The first markup within the section must be the Maturity Levels at the start i.e. state 0 (zero). State 0 has a title (“Start” in the example below) and description, but these are not used or displayed. All security Practices that are to appear on the roadmap must be defined within the <levels> markup.
<state number="0">
	<title>Start</title>
	<description></description>
	<levels>
		<level security-practice="SM" value="1" />
		<level security-practice="PC" value="0" />
		<level security-practice="EG" value="0" />
		<level security-practice="TA" value="0" />
		<level security-practice="SR" value="0" />
		<level security-practice="SA" value="0" />
		<level security-practice="DR" value="0" />
		<level security-practice="CR" value="1" />
 		<level security-practice="ST" value="0" />
		<level security-practice="VM" value="0" />
		<level security-practice="EH" value="0" />
		<level security-practice="OE" value="0" />
	</levels>
</state>
The values for the attribute “security-practice” must match the security Practice attribute “id” defined in the <security-practice> markup tag within the base SAMM XML file (e.g. SAMM-1.0-XML-0.3-en_US.xml mentioned in Part 1). “SM” is “Strategy & Metrics”, “PC” is “Policy & Compliance”, etc.
Subsequent state numbers (1, 2, 3, etc) must include values for the title, description, and as mentioned in Part 1, only data for Practices where the Maturity Level changes should be included:
<state number="1">
	<title>Phase 1</title>
	<description>2010/11 Michaelmas Term</description>
	<levels>
		<level security-practice="EG" value="1" />
		<level security-practice="SR" value="0+" />
 		<level security-practice="ST" value="1" />
		<level security-practice="VM" value="0+" />
	</levels>
</state>
<state number="2">
	<title>Phase 2</title>
	<description>2010/11 Hilary Term</description>
	<levels>
		<level security-practice="SM" value="2" />
		<level security-practice="EG" value="2" />
		<level security-practice="TA" value="1" />
		<level security-practice="DR" value="1" />
		<level security-practice="CR" value="2" />
 		<level security-practice="ST" value="2" />
		<level security-practice="OE" value="1" />
	</levels>
</state>
Subsequent stages are defined in the same manner. The file is saved with an XML extension.
For the eagle-eyed amongst you, you might have noticed a vertical dashed line in the SVG example shown in Part 1, which doesn’t appear in any of the roadmaps in the SAMM document. This is a new optional attribute which can be added to one of the stages. Just add the attribute “marker” with value “true” in one of the <state> tags and the line will be drawn. This might mean "status now" or an important event on the timeline, but that can be described in your accompanying text or presentation.
Validation
We tried the make the source data files as human-readable as possible, but thought we also needed to provide a way to validate the format.
Firstly check the file is well-formed. The simplest method is to use the W3C Markup Validation Service to upload the file or directly input the file content. If your data contains confidential information, you may want to undertake this check locally instead.
Then once the file has passed the previous check, test the XML structure against the XML Schema Definition (XSD) provided in the download link above:
SAMM-1.0-roadmap-0.3.xsd
You will need some sort of XML tool for this. The XSD includes some assertion statements, and therefore needs XSD v1.1 enabled in a Saxon parser. It also has some Schematron statements which should be validated as well.
Now you should have validated XML files.
Continues…
In Part 3 tomorrow, the automated process for transforming the source data into the final SVG files will be described.
Roadmap Chart Generation – Part 1 of 3
Posted by Colin Watson in Discussion, Releases on September 23rd, 2010
OpenSAMM documentation has a big design wow factor and SAMM users, such as development companies, auditors and security consultants, are often keen to mimic the style, especially the graphs. So, last year I developed a Microsoft Excel spreadsheet to help in the creation of roadmap charts.
However it was a bit of a fudge to make the output look similar to the Adobe Illustrator versions in SAMM. The spreadsheet was difficult to alter if you had more than four stages in the roadmap, it was restricted to whole level values (not 0+, 1+ or 2+), and it included background images making it fiddly to edit.
A better way?
Open Office Calc didn’t seem to provide enough functionality to generate the charts, and Microsoft Visio is quite expensive, and even then I couldn’t make it format the data as required. Last year I was invited by David Rook to present SAMM at an OWASP Ireland chapter meeting in Dublin. After the presentation, I spoke with Eoin Keary (OWASP Board member) and we discussed whether a server-side option could be built which would be more flexible. But I had begun using Scalable Vector Graphics (SVG) for another project and realised these would be a better solution for creating the charts, since modern web browsers support SVG markup directly and it could all be created locally rather than using a remote service.
SVG charts
I began working on some mockups, and in March this year posted them to the SAMM mailing list, asking if anyone else had any XML Path Language (XPath) or Extensible Stylesheet Language Transformations (XSLT) experience with which to help improve my initial efforts. Brenda Larcom kindly replied. What a difference she made. Brenda’s initial ideas included:
- have a more explicit/human-readable connection between the state (phase, stage or step) and the target maturity levels for that state;
- use sparse data, i.e. if a level doesn’t change in a state, the chart uses the data from the previous state; and
- segregate data (put the data in elements) from display options (put options in attributes).
We spent the next couple of months bouncing ideas and files back-and-forth, and Brenda’s expertise meant we ended up with a much more compact file structure. SAMM project leader Pravir Chandra also helped by providing all the textual information from SAMM in an XML file. The base US English XML file (version 0.3) for SAMM v1.0 is currently available (SAMM-1.0-XML-0.3-en_US.xml in a Zip archive on the SAMM download page, adjacent to the PDF version). Save that—you’ll need it in Part 3.
With one thing and another, it’s been a little while since then, but Pravir asked if we could share our efforts via this blog rather than using the mailing list alone.
I’d like to begin at the end, and show you examples of the generated SVG files.
Examples
Download the archive of files.
We need an external style sheet (included in the download above) to view the generated SVG files. Extract SAMM-1.0-roadmap-0.4.css into a directory, for example:
e:\path\samm\roadmap-part-1
Then extract the two example SVG files into the same directory. If you view the source of the SVG files, you will just see the XML content like this partial view below:
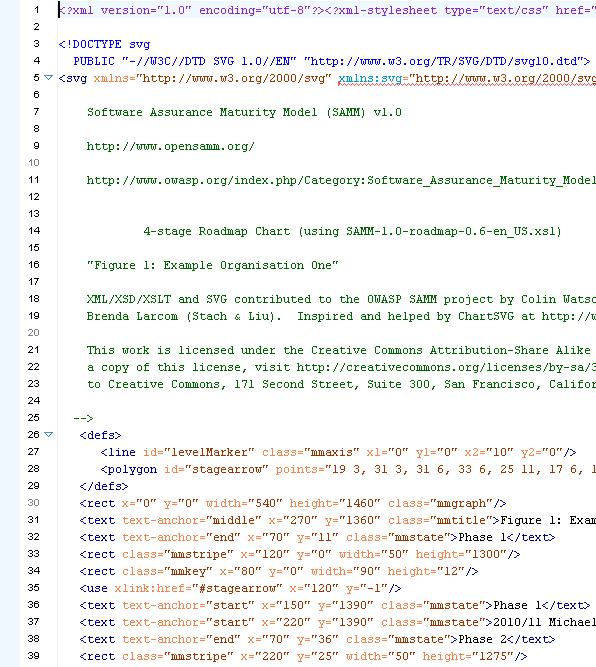
Example SAMM Roadmap Chart Source Code
You can use your web browser to render the chart visually. Open each SVG file in turn from the directory, for example:
file:///e:/path/samm/roadmap-part-1/roadmap-ex1.svg
You should see something like the JPEG screen capture below:
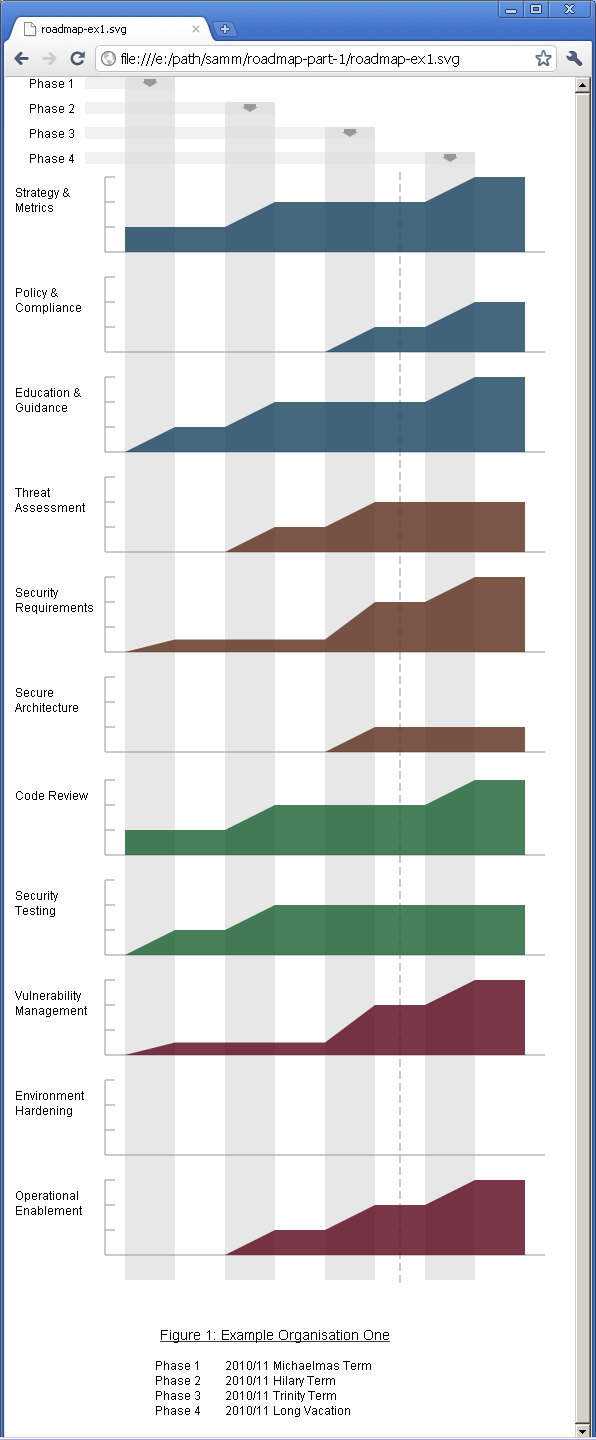
Example Rendered SAMM Roadmap Chart
The charts are of a fixed size, but you can alter your browser zoom level. If you want a static file, take a screen capture the image and paste it into your report. The external style sheet file is referenced from within the SVG file like this:
<?xml-stylesheet type="text/css" href="SAMM-1.0-roadmap-0.4.css"?>
So if you change the CSS filename or location, you must edit the SVG file (perhaps just using a text editor). You can of course customise the CSS file to alter the chart appearance.
Continues…
In Part 2 on Monday, the XML format for source roadmap data will be discussed, and in Part 3 an automated process for transforming that data into the final SVG files, like the one above, will be described.
Resources posted and SAMM in XML
Posted by Pravir Chandra in Discussion on August 21st, 2010
 Over the course of the past year, many people have contributed resources related to SAMM (via the mailing list primarily) and we haven’t had them in an easy-to-find place. Well, that’s all changed now. The new Download page now has all the resources neatly organized for people to download, use, and extend. If you have created any other resources (or made improvements to any that we have posted) please to ping the mailing list with the updates and we’ll link them from this page.
One of the other new items is a full XML version of the SAMM 1.0 framework document. It includes all the content from the whole SAMM document, so now it should be a lot simpler to build tools and automation around the model itself (not to mention making translations into other languages a lot simpler).
Browse the model online
Posted by Pravir Chandra in Discussion on May 4th, 2009

Over the weekend, we managed to get large parts of the SAMM content imported into the OWASP wiki so that folks can browse the model online. This will also support community contributions for additional material that maps under the SAMM activities. It’ll also help for folks making mappings to existing regulatory standards.
The official SAMM releases going forward will still be made in PDF form for mass distribution. The wiki version will syndicate some of the content for easy online referencing, but the PDF version is still the authoritative source of SAMM information.
OWASP Podcast about SAMM
Posted by Pravir Chandra in Press on March 25th, 2009
 I recorded an OWASP Podcast episode with Jim Manico and it just went live. We discuss the new SAMM release, some of the project’s history, and, of course, some other favorite projects of mine. Jim is a great host and I can’t wait to get invited for another!
SAMM Presentation at OWASP NYC 2008
Posted by Pravir Chandra in Press on September 25th, 2008
As the project lead for the OWASP CLASP Project, I was invited to speak at the OWASP NYC conference to introduce SAMM and discuss details with attendees. The conference and my talk had a great turn out, and I was impressed with the amount of feedback received. Both slides and video from my presentation (below) are online as well as from all the talks at the conference.
