Yesterday Part 2 described how to create and validate the source roadmap data files. In this post, transforming the data files into the final SVG format we saw in Part 1 will be described.
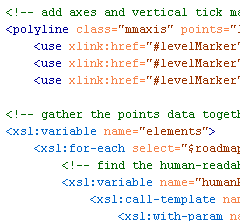
The great thing about having data in XML is the ability to translate it easily into another format using Extensible Stylesheet Language Transformations (XSLT).
Transformation
Download the archive of files.
With Brenda’s assistance we now have an XSLT file which can be used to translate a valid and well-formed SAMM Roadmap source data file into a valid SVG file. You need the two XSL files included in the archive download linked above:
SAMM-1.0-roadmap-0.6-en_US.xsl
SAMM-1.0-utilities-0.1.xsl
You also need the base US English XML file (version 0.3) for SAMM v1.0 and your XML data files. The archive includes the two example XML files from Part 1 (again) and the US English SAMM base XML file. Remember the latter should normally be downloaded from the SAMM download page. Place all the files in a new directory.
Take a tool which can undertake XSLT conversions, and apply SAMM-1.0-roadmap-0.6-en_US.xsl to your XML file or one of the examples. An SVG file should be created.
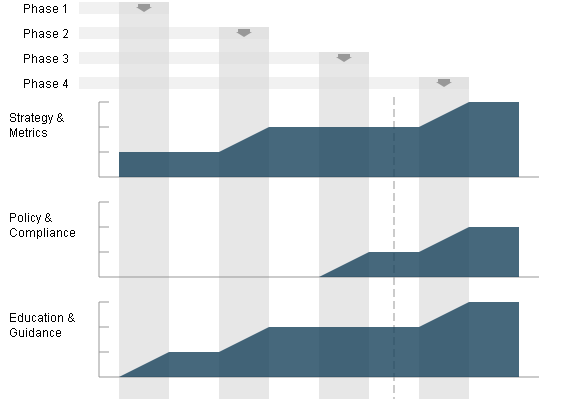
Partial screen capture (as a JPEG) of a generated SVG SAMM Roadmap Chart
And that’s it. Alter your XML files to see the effect on the generated SVG charts.
If you don’t want to use XML and XSLT, you can of course just edit the SVG files directly using some sort of text editor.
Next
I hope to spend some time creating SVG charts for the SAMM scorecard charts sometime soon.
