Building on the work undertaken with Brena Larcom to create SAMM roadmap charts (Part 1, Part 2 and Part 3), I have developed a similar process for single point in time scorecards.

Example Single Point In Time Scorecard
The XML is a very similar structure as used for the roadmap charts, but only one set of data are required.
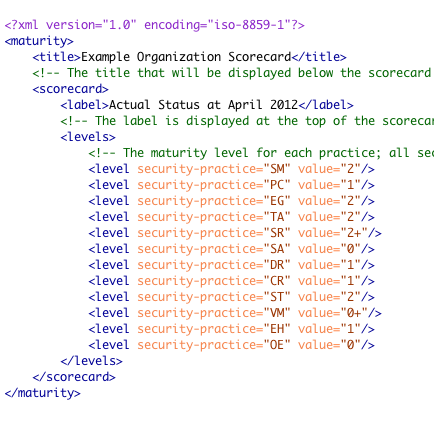
Source XML Data to Create the Example Scorecard
Like the roadmap files, Maturity Level information can be 0, 1, 2 and 3 or where there is additional assurances in place beyond those indicated by the Level, the “+” symbol can be used so 0+, 1+ and 2+ are also allowed.
Download the files
Download the archive of files.
The archive includes the an example XML file and the US English SAMM base XML file. Remember the latter should normally be downloaded from the SAMM download page. Using a web browser, open the example SVG file from the directory, for example:
file:///e:/path/samm/scorecard/scorecard-ex1.svg
Create your own chart
Edit and save the XML file. Then check the file is well-formed. The simplest method is to use the W3C Markup Validation Service to upload the file or directly input the file content. If your data contains confidential information, you may want to undertake this check locally instead.
Then once the file has passed the previous check, test the XML structure against the XML Schema Definition (XSD) provided in the download link above:
SAMM-1.0-scorecard-0.2.xsd
Take a tool which can undertake XSLT conversions, and apply SAMM-1.0-scorecard-0.2-en_US.xsl to your XML file. An SVG file should be created. That’s all there is to it.
Again if you don’t want to use XML and XSLT, you can just edit the SVG files directly using some sort of text editor.
